Wind Farm SCADA Ops: Fix 10 Min Logs That Hide 90 Sec Faults
Practical guide for wind farm operators and analysts: SCADA architecture, public datasets, sampling and timestamp fixes, analytics workflows, and no-code...

A wind farm SCADA system is the software and hardware network that pulls real-time telemetry (wind speed, power output, rotor speed, alarms) from every turbine into one control platform, then logs it for historical analysis. Operators use it to catch faults early, tune performance, and dispatch commands back to the turbines. Engineers and analysts rely on the same data stream for availability tracking, predictive maintenance, and safety oversight.
TL;DR:
- Most public datasets have gaps in intervals, sensor drift over months, and failure events under 5%, requiring careful preprocessing for modeling.
- Alarm thresholds should be turbine-specific, validated with six months of historical data, and continuously updated through an incident response loop for reliability.
- Standard protocols like OPC UA and Modbus facilitate data exchange, but mismatched units and timestamp misalignments need mapping and synchronization beforehand.
- Simple anomaly detection methods like rolling z-scores outperform complex models initially, with high-resolution buffers essential for identifying short-term faults.
- No-code 3D visualization platforms can accelerate fault localization and training by adding spatial context over existing SCADA data without changing core infrastructure.
Table of Contents
SCADA Capabilities and Common Data Fields for Wind Farms
Every wind turbine SCADA system exports a fairly standard set of channels, and if you’ve worked with more than one vendor’s platform, you already know the field names shift slightly, but the physics underneath does not. A typical setup tracks wind speed, rotor speed, wind direction, and outdoor temperature alongside power output, with the historian accumulating all of it for later analysis.
The core channel list breaks down like this:
Wind speed and direction (yaw error): nacelle anemometer readings plus the deviation between wind heading and rotor orientation, which drives yaw motor commands.
Rotor and generator speed: two related but distinct measurements, since gearbox ratio (or the lack of one, in direct-drive machines) separates them.
Blade pitch angle: reported per blade, critical for power regulation above rated wind speed and for detecting pitch actuator drift.
Active and reactive power: the primary revenue signal, alongside power factor for grid compliance.
Nacelle, gearbox, generator, and bearing temperatures: early indicators of lubrication or cooling problems.
Vibration channels: present on turbines with condition monitoring systems bolted onto SCADA, though not universal.
Alarms and event logs: timestamped fault codes, curtailment events, and safety trips.
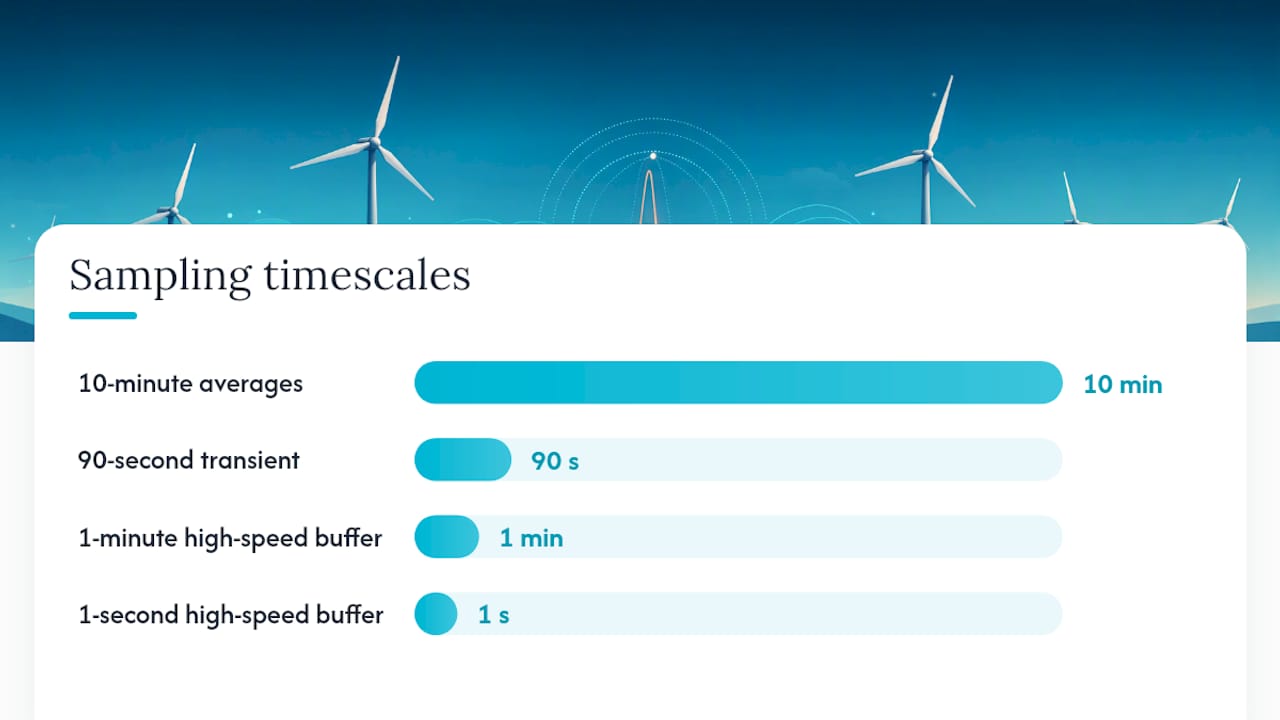
Sampling rates matter more than most new analysts expect. Most commercial SCADA platforms default to 10-minute averages for the historian, which is fine for capacity factor calculations but hides transient events entirely. A gearbox bearing spike that lasts 90 seconds vanishes into a 10-minute mean. Some platforms also log 1-second or 1-minute high-speed buffers around alarm triggers specifically to preserve that detail, but continuous high-speed logging at scale eats storage fast, so most sites reserve it for post-event forensics rather than everyday operation.
Timestamp alignment is the quiet troublemaker in every multi-turbine dataset. Turbines on different firmware versions, or ones added to the farm at different commissioning phases, can report on slightly offset clocks. If you’re stacking data across dozens of turbines for a fleet-wide model, misaligned timestamps introduce noise that looks like real variance but is not.
From these raw channels, a handful of derived metrics do most of the operational heavy lifting: the power curve (measured power against wind speed, compared to the manufacturer’s theoretical curve), capacity factor, time-based and energy-based availability, and event-driven downtime attribution. None of these require exotic math. All of them require clean, well-aligned raw data, which is why the sampling and timestamp issues above are worth taking seriously before any modeling starts.
Wind Farm SCADA Architecture and Key Components
Wind farm SCADA architecture follows a layered pattern that has held up since the earliest generic wind farm SCADA architecture frameworks were documented, and it still maps cleanly onto today’s systems.
Turbine-side hardware. Each turbine runs a PLC or RTU that talks to local sensors, the pitch and yaw drives, and safety interlocks. This controller handles closed-loop decisions in milliseconds, things too fast for a central system to manage remotely, and exports a subset of that data upstream.
Fieldbus and turbine-to-substation links. Turbines usually connect over a fiber ring or industrial Ethernet to a substation concentrator, often using Modbus or a proprietary protocol translated at the edge.
SCADA concentrator to WAN. The substation aggregates all turbine feeds and forwards them over a wide-area link, fiber where available, cellular or satellite for remote sites, to the central SCADA server. This hop is where latency and packet loss most often creep in, especially at offshore or mountainous sites.
Central SCADA server and historian. This is where live data lands for the HMI and where it gets written to a time-series historian for retention. Retention policies vary widely; some operators keep raw 10-minute data indefinitely and downsample anything older than a year.
Operations center HMI. The human interface layer, showing farm-wide status, active alarms, and control permissions. Wind-energy technical references describe this whole assembly as the project’s nerve center, which is a fair description given how much depends on it staying online.
APIs and third-party connectors. Modern platforms expose REST or OPC UA endpoints so analytics tools, forecasting engines, and asset management software can pull data without touching the operational SCADA network directly.
Where things go wrong is fairly predictable. Data loss most often shows up at the substation-to-WAN hop, particularly on cellular backhaul during storms, which is unhelpfully exactly when you want the most reliable data. Time skew tends to originate at the turbine controller level when firmware updates reset internal clocks without resyncing to a network time source. If a fleet-wide dashboard suddenly shows one turbine reporting values a few minutes ahead of its neighbors, check the NTP sync status before assuming a sensor fault.
Redundancy design also deserves a mention here because it’s often skipped in smaller installations. Enterprise-grade deployments run a hot standby SCADA server and mirror the historian, so a server failure doesn’t create a data gap. Retrofitted or older farms sometimes run a single server with no failover, which means every server reboot is a small hole in the historical record.
Where to Find Public Wind Turbine SCADA Datasets
If you’re building models rather than running a live farm, you don’t need proprietary access to get started. A handful of public repositories carry real turbine telemetry, and each has its own quirks worth knowing before you commit a research project to one.
Kaggle’s wind turbine SCADA dataset records 10-minute-interval telemetry covering active power, wind speed, theoretical power curve, and wind direction. It’s a solid entry point for power curve modeling and is small enough to load in memory on a laptop.
Zenodo hosts multiple wind SCADA datasets and records suited to benchmarking condition-monitoring algorithms, often with richer metadata than commercial-grade exports and DOI-backed citability for academic work.
OpenWindSCADA and similar GitHub collections aggregate community-contributed SCADA logs, sometimes with fault labels attached, though coverage and quality vary by contributor.
Most of these datasets license under Creative Commons Attribution 4.0, meaning you can reuse and republish derived work as long as you credit the source. Worth checking every time, since a few older academic releases carry more restrictive terms.
On format: CSV remains the default for smaller datasets, and the main headache is timestamp parsing. Many exports store local time without a timezone offset, which becomes a real problem the moment you merge turbine data from sites in different time zones or that observe daylight saving differently. Normalize everything to UTC before joining tables. For anything beyond a few hundred megabytes, Parquet compresses and queries far faster than CSV, and most Python and R tooling reads it natively now.
On quality, three issues show up in nearly every public SCADA dataset:
Missing intervals where the historian dropped a reporting window, often clustered around communication outages rather than randomly distributed.
Aggregated 10-minute timestamps that obscure the underlying transient behavior, a limitation worth stating up front in any paper that uses this granularity.
Sensor drift, particularly in older anemometers, that shifts wind speed readings gradually over months without any flag in the metadata.
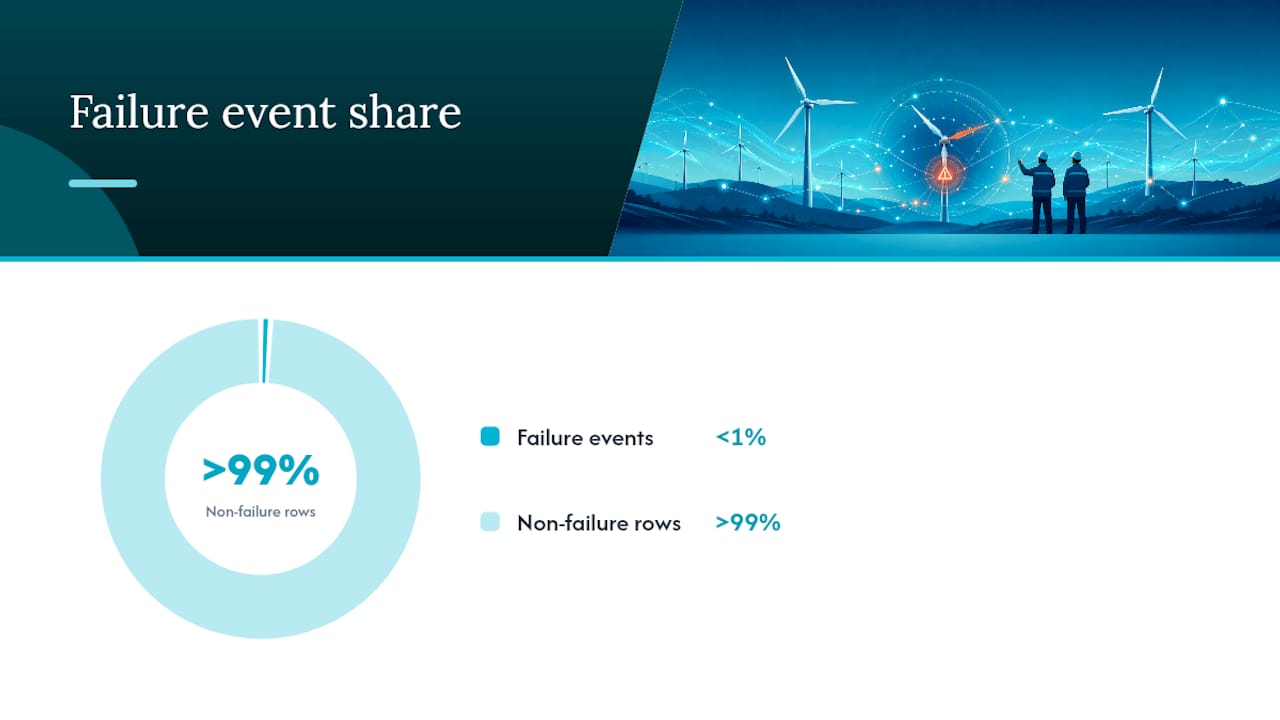
A less obvious problem, and one that catches a lot of first-time modelers off guard, is failure label imbalance. In any realistic operational dataset, actual failure events are rare, sometimes under 1% of total records, so a naive classifier trained without resampling or class weighting will just learn to predict “no fault” and score deceptively well doing it.
Pro Tip: Before modeling anything, plot a histogram of your target variable’s class distribution. If failure events make up less than 5% of your rows, address that imbalance with weighted loss functions or synthetic oversampling before you trust any accuracy metric the model reports.
Match the dataset to the project. Power-curve modeling tolerates the 10-minute Kaggle-style data fine. Anomaly detection benefits from higher-resolution Zenodo records where available. Predictive maintenance work needs labeled failure events, which is the scarcest resource across every public repository, and often means combining SCADA data with maintenance logs that were never designed to be joined together.
How Analytics and Condition Monitoring Turn SCADA Data Into Action
Different operational questions call for genuinely different analytic approaches, and picking the wrong one wastes both engineering time and compute budget. A recent state-of-the-art review of condition monitoring using SCADA data confirms that the field has moved well past simple threshold alarms into a mix of statistical and machine learning techniques, matched to the maturity of the data available.
Here’s how the main approaches map to common problems:
Threshold and alarm tuning works for well-understood limits, like maximum bearing temperature, and needs no historical failure data at all, just physical operating limits from the manufacturer.
Rule-based failure detection layers logic across multiple channels (“if temperature rises while load stays flat, flag it”) and works well once you understand a specific failure signature.
Unsupervised anomaly detection, using methods like autoencoders or isolation forests, flags deviations from normal operating behavior without needing labeled failures at all, useful early in a monitoring program before you’ve accumulated failure history.
Supervised classification for specific failure modes needs labeled examples of each fault type, ideally dozens of instances minimum per class, which is exactly the imbalance problem covered above.
Time-series forecasting for power output or load, using models from ARIMA to gradient-boosted trees to LSTM networks, supports both operational planning and energy forecasting workflows that feed grid dispatch decisions.
Getting a model into production is a different job than building one in a notebook. Alert pipelines need a human-in-the-loop verification step, at least initially, because an unsupervised model with no review layer will generate alarm fatigue fast if its false-positive rate isn’t tracked. Watch precision and recall on live alerts weekly, not just at model deployment, since sensor drift and seasonal wind patterns both degrade model performance over time in ways a one-time validation won’t catch.
Start simple. A rolling z-score on gearbox temperature, normalized against ambient temperature and load, catches a surprising share of real anomalies before you need anything more sophisticated. Build that baseline first, measure how it performs against your actual fault history, and only reach for unsupervised or supervised models once you know exactly what the simple approach misses.
Integration, Protocols, and Secure SCADA Communications
Interoperability between turbine controllers, SCADA servers, and third-party analytics tools comes down to a small set of protocols doing most of the work across the industry.
OPC UA has become the default for modern SCADA-to-analytics integration, offering a standardized, secure way to expose live and historical tags to external systems without custom point-to-point code.
Modbus remains common at the turbine and substation level, particularly on older installations, valued for its simplicity even though it lacks native encryption.
IEC technical references relevant to wind operations cover everything from power curve measurement standards to communication protocols, giving vendors and operators a shared vocabulary for compliance and interoperability.
Getting data out of SCADA and into cloud analytics platforms usually runs through a historian connector or a dedicated API gateway, rather than querying the operational database directly, which protects the control network from analytics workloads that could otherwise slow it down. Vendor upgrade paths, like the WindNet PRO SCADA platform, now build this connectivity in as a standard feature rather than a bolt-on, reflecting how central third-party analytics has become to modern operations.
Cybersecurity deserves equal weight here. Network segmentation, keeping the operational SCADA network separate from corporate IT and internet-facing systems, remains the single most effective control against intrusion. Secure tunnels (VPN or TLS-encrypted connections) protect data in transit between substations and the central server. The principles behind IEC 62443, covering security levels and zone-based network design, apply directly to wind farm SCADA even though the standard wasn’t written with turbines specifically in mind.
One practical headache worth flagging: channel naming and unit mismatches across vendors. One manufacturer’s “WindSpeed_Avg” is another’s “WS_10min_Mean,” and pitch angle might arrive in degrees from one turbine model and radians from another after a firmware update. Build a mapping table before merging multi-vendor fleet data, or you’ll spend more time debugging unit errors than building models.
Best Practices for Reliable SCADA Data and Analytics
Getting SCADA data pipelines from “technically working” to “reliably useful” takes a specific set of operational habits, most of which get skipped under deployment pressure and paid for later in bad alerts and distrustful operators.
Tune alarms per turbine, not per fleet. A single global threshold ignores real variation in turbine age, site conditions, and component wear. Turbine-specific tuning paired with failure-mode-specific logic consistently cuts false alarm rates compared to blanket site-wide thresholds.
Set retention policy deliberately, not by default. Raw 10-minute data for two years, downsampled hourly averages beyond that, is a common balance between storage cost and analytical usefulness, though high-value sites sometimes justify longer raw retention for warranty disputes.
Validate before production. Run any new alarm rule or model against at least six months of historical data with known events before it goes live, and check its false-positive rate on quiet periods specifically, not just its hit rate on known faults.
Build an incident response loop. Every false alarm and every missed fault should feed back into either threshold tuning or model retraining, on a defined cadence rather than an ad hoc basis.
Pro Tip: Log every alarm acknowledgment and its outcome (real fault, false positive, or operator override) in a structured table. Six months of that log is worth more for improving alarm accuracy than any amount of theoretical tuning.
Data governance sits underneath all of this. Decide who can write to control tags versus who has read-only access to historian data, document it, and audit it periodically. It’s the kind of task that feels bureaucratic right up until an unauthorized change causes downtime.
How 3D Visualization Extends Traditional Wind Farm SCADA
Standard SCADA dashboards give you numbers and trend lines. They rarely give you a clear sense of where a fault actually sits physically, especially across a farm with dozens of turbines, several substations, and grid interconnection equipment spread across miles of terrain. That’s the gap no-code 3D SCADA platforms like Kingfisher 3D SCADA are built to close, layering a spatial digital twin on top of the same live data feeds your operations team already relies on.
The practical difference shows up in a few specific scenarios:
Substation and switchgear layout. When an alarm fires on a specific breaker or transformer, a 3D model showing exact physical placement gets a technician oriented faster than scrolling through a tag list.
Clustered turbine troubleshooting. On farms with tightly spaced turbines, spatial context helps operators quickly distinguish which unit is actually affected when alarms cascade across a row during a grid event.
Operator training. New staff build a working mental map of the site faster from an interactive 3D model than from static single-line diagrams, cutting onboarding time before someone is trusted on live systems.
Kingfisher 3D SCADA’s drag-and-drop modeling and its marketplace of over 1,000 ready-made industrial components mean engineers can build a working digital twin without writing scripts or waiting on a systems integrator, which matters most for smaller operators who don’t have a dedicated visualization team on staff.
A digital twin doesn’t replace the historian or the alarm engine. It gives the same data a spatial context that a flat trend chart can’t provide, and that context is often what turns “something is wrong” into “I know exactly where to go” thirty seconds faster.
This is an addition to standard SCADA workflows, not a substitute for them. The historian still owns the data of record. The 3D layer just makes that data faster to interpret when seconds matter, whether that’s a fault at 2 a.m. or a training session for a new hire.
What the Data Actually Tells Us About Wind Farm SCADA
Most guidance on wind farm SCADA treats data quality as a footnote. It shouldn’t be. The gap between a model that performs well in a paper and one that holds up on a live farm almost always comes down to timestamp alignment, sensor drift, and failure label imbalance, not the choice of algorithm. Spend the time cleaning before modeling; it pays back more than any architecture change.
The conventional advice to “collect more data” also deserves pushback. Ten years of 10-minute averages doesn’t help you catch a fault that develops over 90 seconds. Depth of resolution around actual events matters more than raw volume of historical logs, and few operators budget for the high-speed buffer logging that captures it.
If you’re starting from scratch, prioritize in this order: clean timestamp alignment, a simple statistical baseline, then turbine-specific alarm tuning. Sophisticated models come last, not first, and only after the baseline tells you what they’d actually need to improve on.
Get Started With No-Code 3D SCADA for Your Wind Farm
No-code 3D SCADA platforms give wind farm operators and engineering teams a way to add spatial context to existing SCADA data without hiring a systems integrator or learning a scripting language. Where legacy visualization tools require weeks of custom development for even a basic site layout, no-code 3D SCADA platforms offer drag-and-drop editors and AI-powered scene generation from schematics or photos to build a working digital twin more quickly.
Such platforms can connect to existing real-time data feeds, so nothing about your historian, alarm logic, or control architecture needs to change. What changes is how fast an operator can locate a fault, and how quickly a new team member gets oriented on a sprawling site. The component marketplace covers turbines, substations, and balance-of-plant equipment with ready-made assets, so modeling a multi-turbine site doesn’t mean building every transformer and switchgear cabinet from scratch.
If you’re managing a wind farm and want to see what a 3D digital twin looks like layered over your own SCADA feeds, start with the platform overview and request a walkthrough of how it fits your site’s specific layout and data sources.